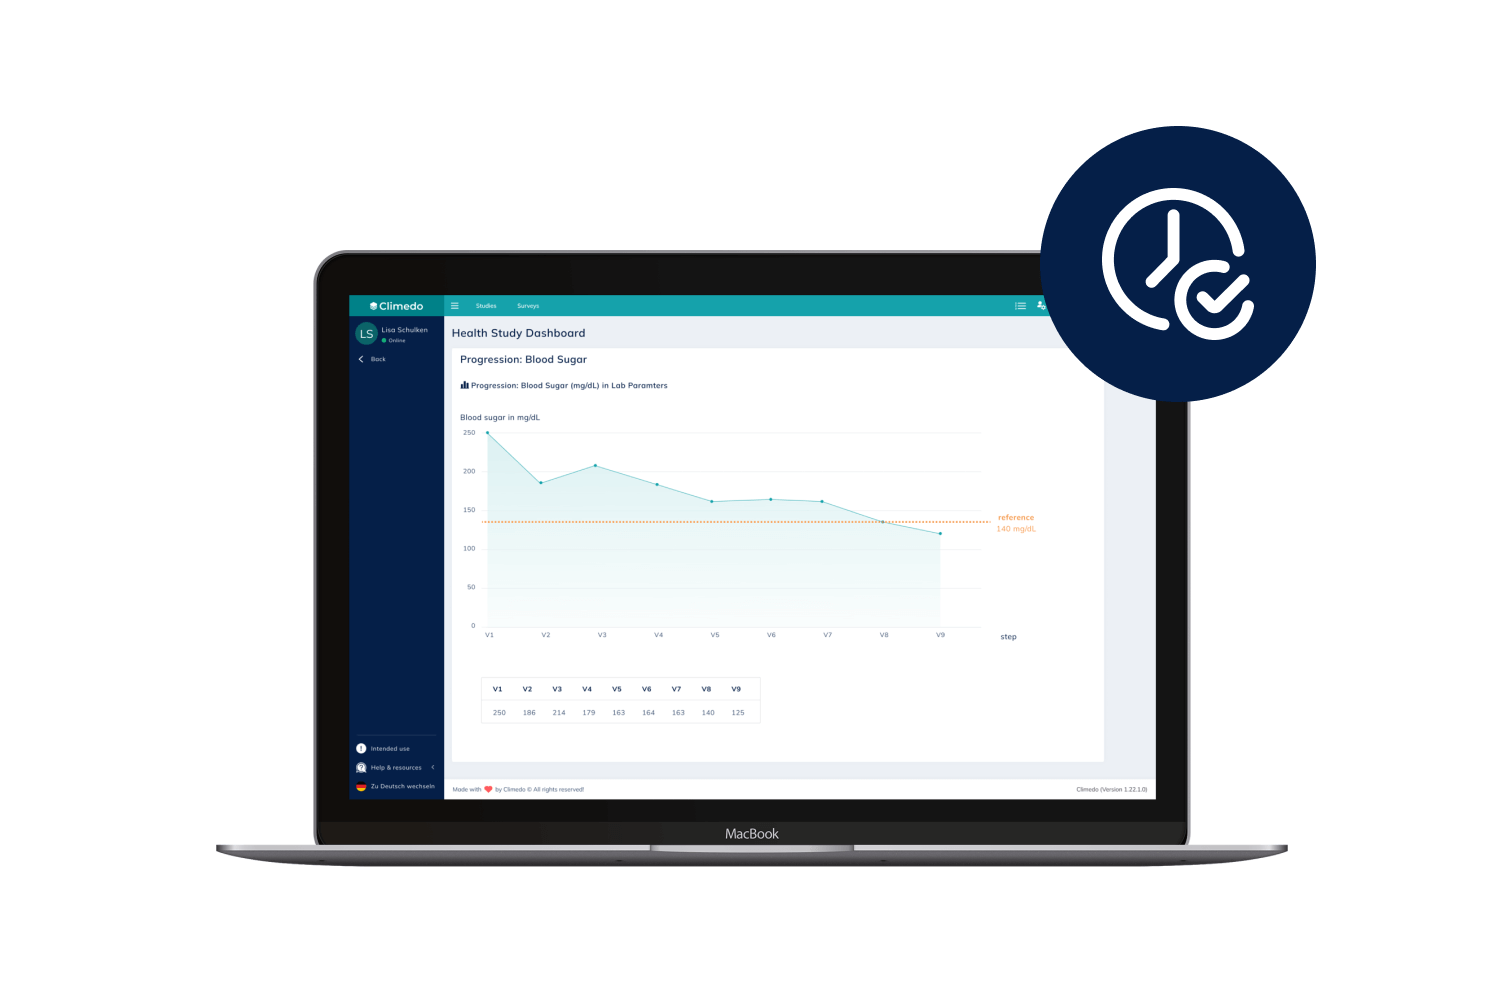
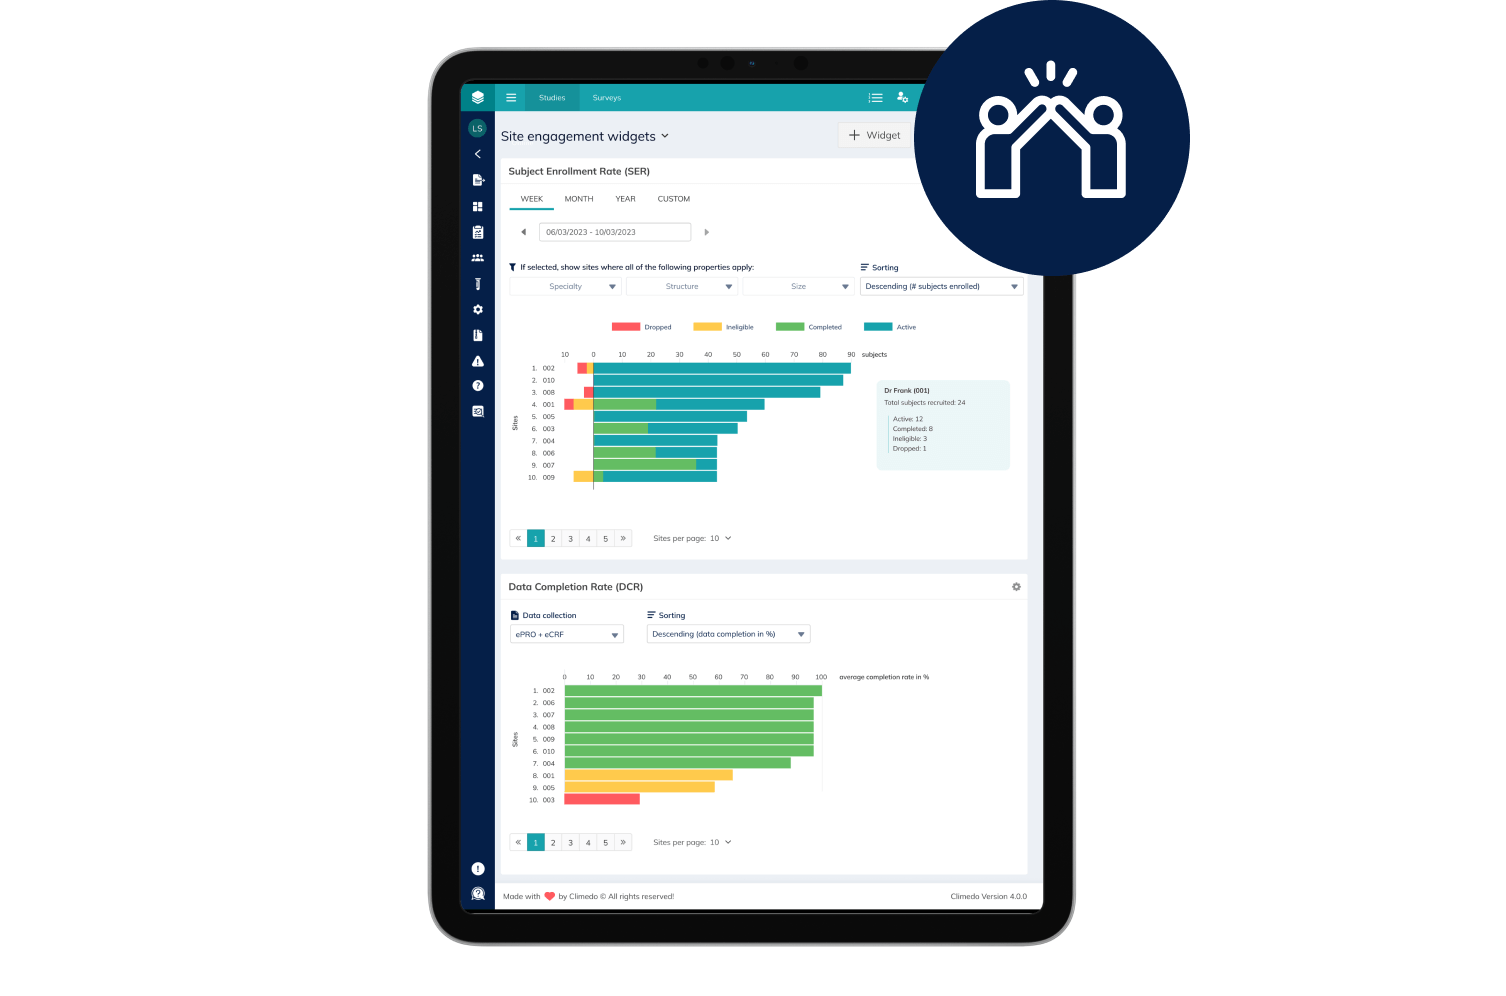
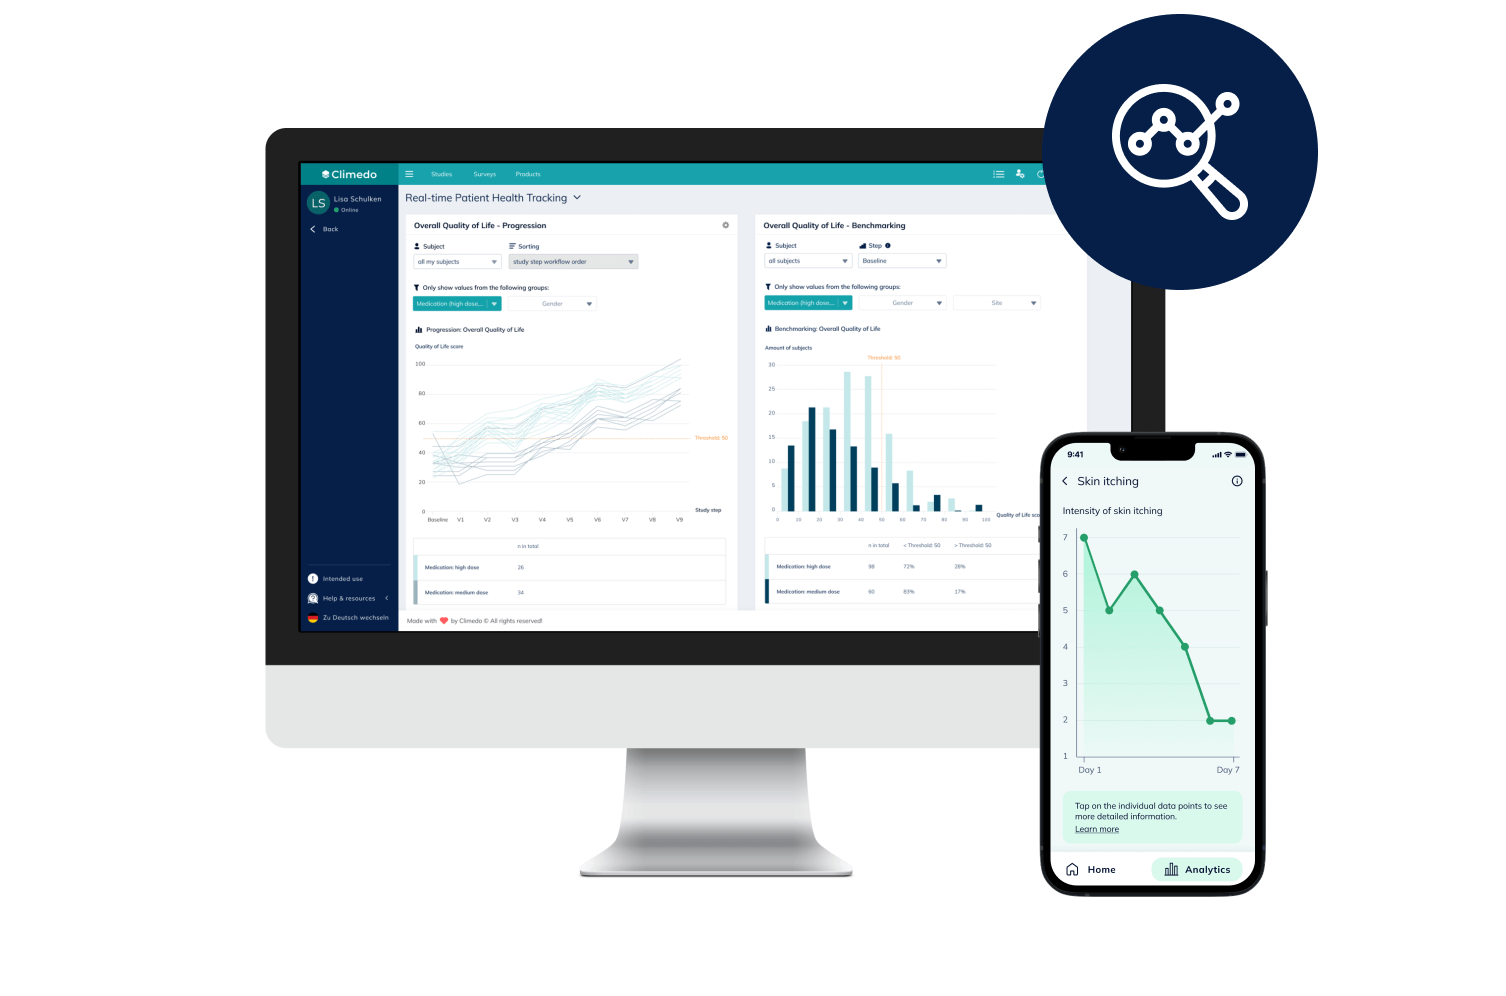
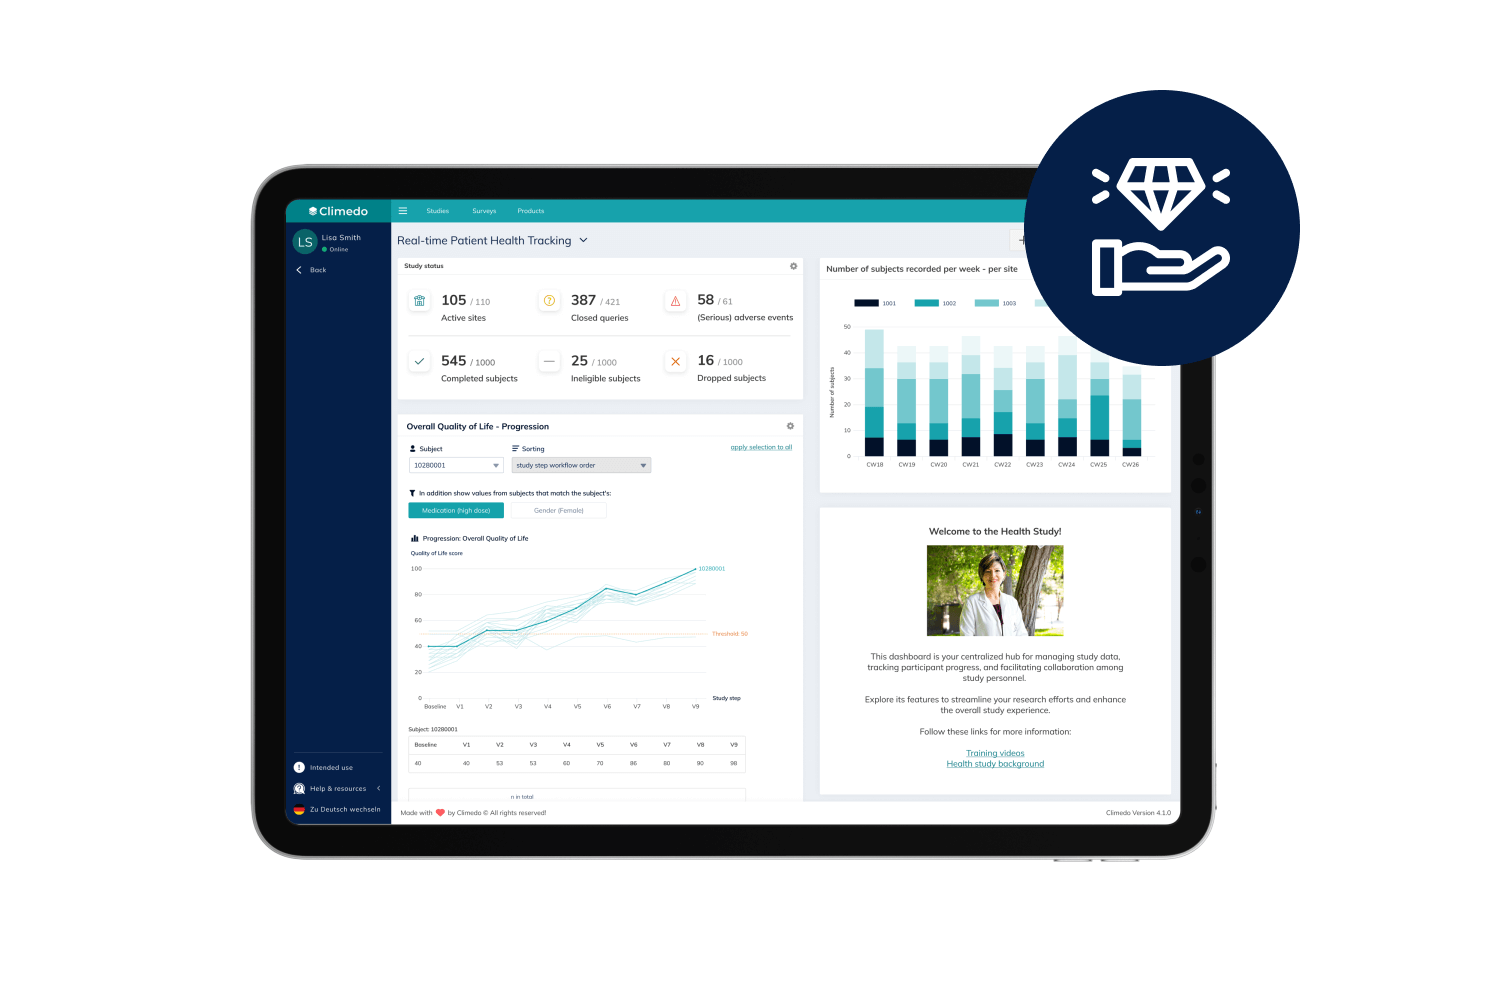
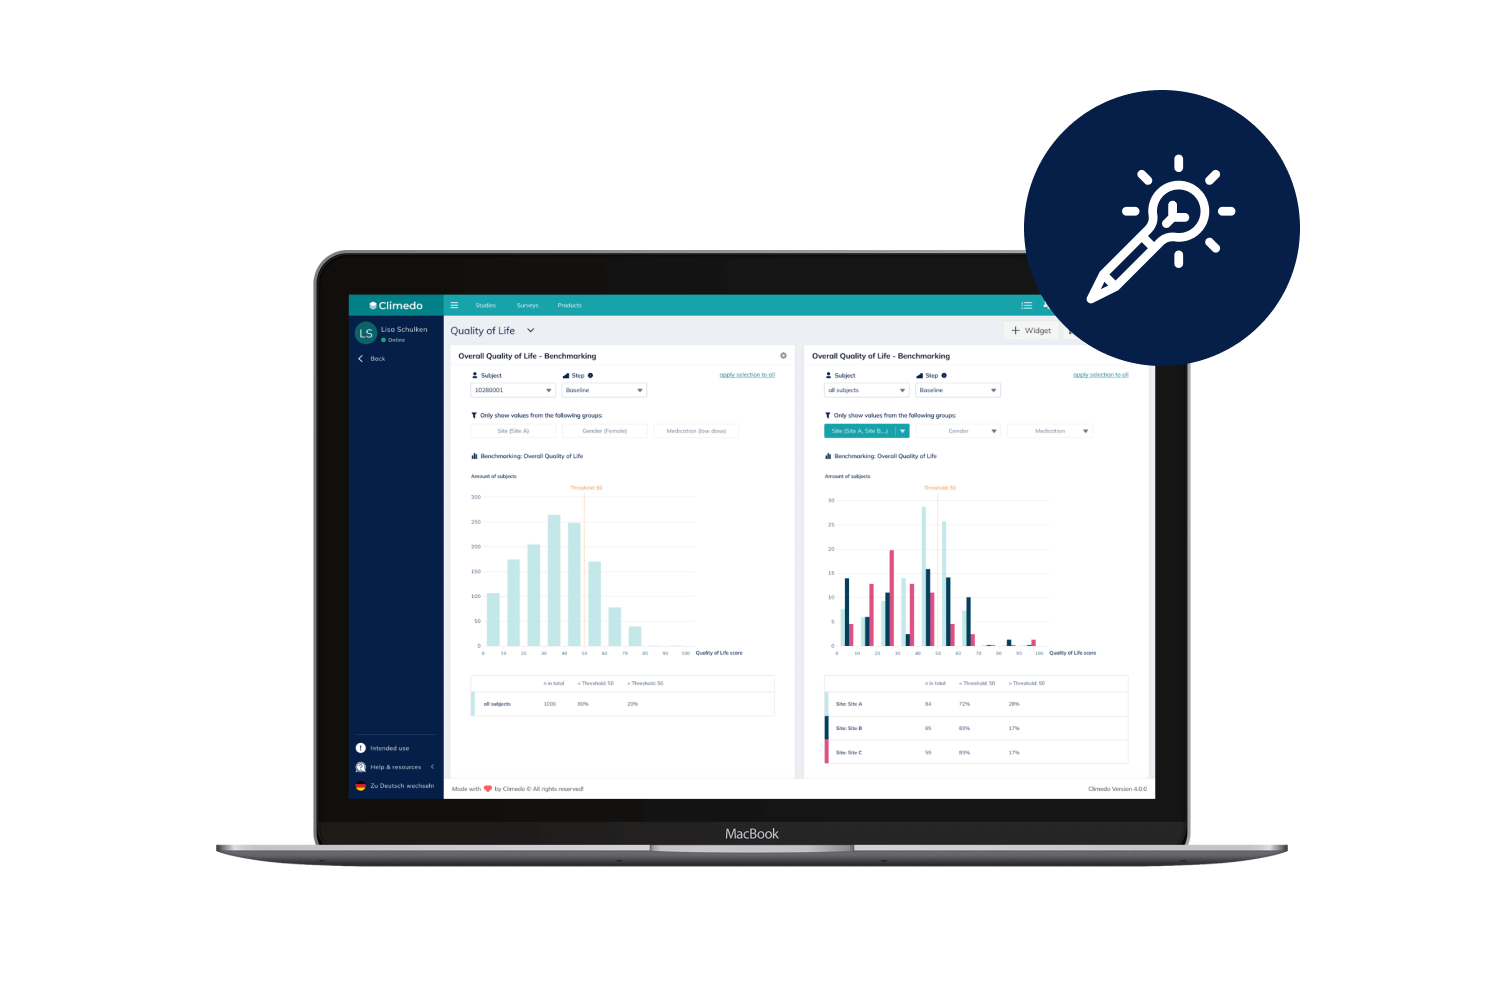
Turn Data into Dialogue with Real-Time Visualizations and Insights

Climedo’s interactive dashboards allow for real-time visualization of clinical trial data as well as the comparison between patient cohorts across different study sites. This boosts KOL engagement, fosters scientific dialogue and improves patient centricity.

How does it work?

How are specific study subjects doing for certain lab parameters compared to the overall study population? Which differences can be identified for certain gender and age groups or regions?

These are just some of the questions which are often asked by study sponsors, sites and KOLs. Thanks to Climedo’s dashboard features “Benchmarking” and “Progression”, sponsors and sites can be supported in visualizing and evaluating the captured results.

Another major advantage here is that trends can be identified at an early stage without having to wait for the official interim analysis, which often only comes months later

Learn more in our current Whitepaper.

Please note: The data should be used on a descriptive basis and merely serves as a discussion basis, e.g. to discuss the HCP’s potential participation in the study. It is not intended to be representative while the study is underway.

From Data to Dialog

Benchmarking

For medical data:
The Benchmarking feature allows users to anonymously compare a defined data point of a subject to the benchmark of the overall study population. The population can be filtered by different criteria, such as gender, age group, cohort or region. Furthermore, sponsors are able to compare different sites to one another.

Progression

For medical data:
The Progression feature enables users to see the progression of a defined data point of a single subject or all subjects, captured over a specific period of time (such as multiple site visits). This helps to identify outliers. 

One new feature here is our patient progression widget. This enhances patient engagement by offering patients real-time access to their own data and trajectory. 

Recruitment & Site Engagement

For management, KPIs and performance:
It is also possible for dashboards to reflect KPIs of individual sites to make their performance transparent in terms of patient recruitment success and data completeness, potentially boosting site motivation. This will allow you to monitor the quantity versus quality, i.e.  the number of patients versus their reporting completeness on a per-site level. 

Product Demo

We offer different packages and prices - tailored to you and your needs.

We'll show you how to start a clinical trial or survey and address your specific needs and desires.

Your benefits with Climedo

Real-time medical outcomes communication

With the help of dynamic data visualizations in real time, users can always see the current progress of their patients and detect possible outliers or changes in medical parameters at an early stage. This allows for increased transparency.

Motivation of sites

Our Recruitment and Site Engagement dashboard boosts motivation among study sites, as they can directly compare their performance with one another anonymously. It is possible to set up specific rankings and sites can see their position within those rankings.

Data at the HCPs’ and patients’ fingertips

Thanks to the visualization of long-term progression and the comparison across different populations as well as target values, users can view the results of each individual patient. For the next level of patient centricity, Climedo can even enable patients to view part of their own data.

Intuitive user interface

All stakeholders – sponsors, CROs and healthcare professionals (HCPs) – can access key data in just 1 click with no programming skills, thanks to Climedo’s simple and engaging user interface. On the patient side, Climedo’s high level of intuition and simplicity has repeatedly resulted in 95% reporting completeness.

100% flexibility in dashboard set-up

Users can generate reference and target values, benchmarking filters, edit the granularity of comparison groups as well as axis settings. It is also possible to customize different standard views, e.g. according to region or age, and find things more easily.

Image
Image
Image
Image
Image

Data security

Made in Germany

At Climedo, data security comes first. Our servers are officially certified in the field of information security (ISO 27001 – Standards for Information Security Assurance). In addition, we rely on strong data separation and state-of-the-art encryption methods. At the federal level, our system has also been tested by the BSI and the BfDI.

Germany

90%

Patient Compliance

Thanks to the simple handling (independent of location or device), the intuitive usage and the automated reminders, you'll see higher participation and completion rates.

54%

Higher data quality

Direct patient feedback and paperless data collection will improve your data quality. With Climedo, the error-prone transfer of paper to Excel sheets and illegible handwriting become a thing of the past.

49%

Time savings

Faster results thanks to automated processes, reusable forms and decentralized study designs as well as remote monitoring.

Digital Health Bites

Go to our Blog Arrow Right Mini
Product Demo
We offer different packages and prices - tailored to you and your needs.