Clinical Trials: Increasing the Visibility of Research with Visual Abstracts

DATE
February 16, 2023
AUTHOR
Dragan | Co-Founder & CTO
Guest blog by Sabine Ditz and Dr. Ramona Schütz, GKM Gesellschaft für Therapieforschung mbH
Communication of scientific results to the public is a very important part of research. The new EU CTR also requires that the results be communicated to the general public in a language understandable to lay persons. Furthermore, social media provides great dissemination channels for researchers to attract readers. Appealing formats are essential in this context. Visual abstracts provide an elegant solution for the communication of scientific results in a clear and concise way and can support in meeting regulatory requirements, such as the provision of lay summaries as part of the EU CTR. This article provides scientists with hands-on advice on how to draft visual abstracts.
Visual Abstract – Definition
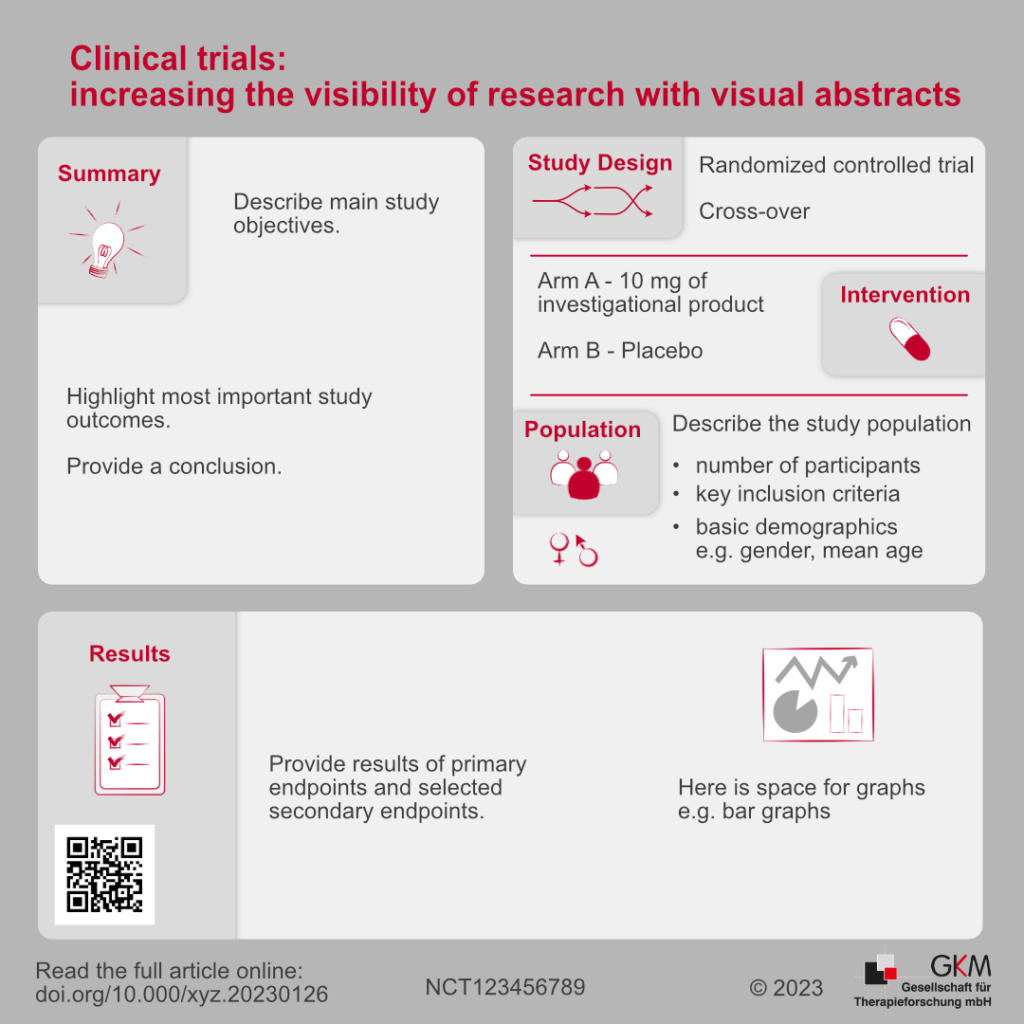
A visual abstract, also called graphical abstract, is a graphical version of the abstract of a scientific article. Usually, it consists of one image divided into different sections, giving the viewer an easy-to-understand visual summary of the key points of a scientific publication. First promoted by Andrew Ibrahim, this format of presentation has now been embraced by many scientific journals (5, 7). The implementation, the style and the amount of text vary widely between different journals.
In addition to being published in a journal, visual abstracts are also suitable to be shared on social media, where they can be disseminated to a broader audience, e.g. scientists from other fields as well as lay audience, and create additional traffic for the publication. However, the visual abstract does and shall not replace reading the full publication. Its aim is to raise interest in fellow scientists as well as interested non-scientists and facilitate an informed decision whether to read the publication or not (5, 7).
Visual Abstract – Reasons and Implications
“A picture is worth a thousand words”
This proverb might be well worn, but that does not make it less true. Photographs and images can transport complex information in a limited space and the human brain processes them faster than text. Further, they naturally attract the attention of our eyes, reduce the mental load when processing complicated information and improve recollection (6–8). Scientists should use these features to their advantage when presenting their research.
The introduction of alternative metrics (altmetrics) to measure the distribution of a publication on social media, especially Twitter, alongside the traditional measurement of impact (defined by the impact factor of the journal and the number of citations) shows the importance of sharing research through new information channels (7, 9). Posts that include images engage more interaction (clicking, liking or sharing) than those without, which leads to an increased visibility among fellow researchers, health professionals as well as the general public and consequently increases the number of clicks on the publication link (3, 7, 9).
An important aspect of visual abstracts is the accurate representation of study results. Guidolin et al. developed a “Visual Abstract Assessment Tool” to assess the quality and accuracy of visual abstracts and found great variation in quality across different journals. In nearly two thirds of the evaluated visual abstracts, the study design was not featured and in more than half, misleading icons were used (4). These findings imply a need for standardization for the design of visual abstracts across journals to ensure high quality results that reduce the risk of misinterpretation.
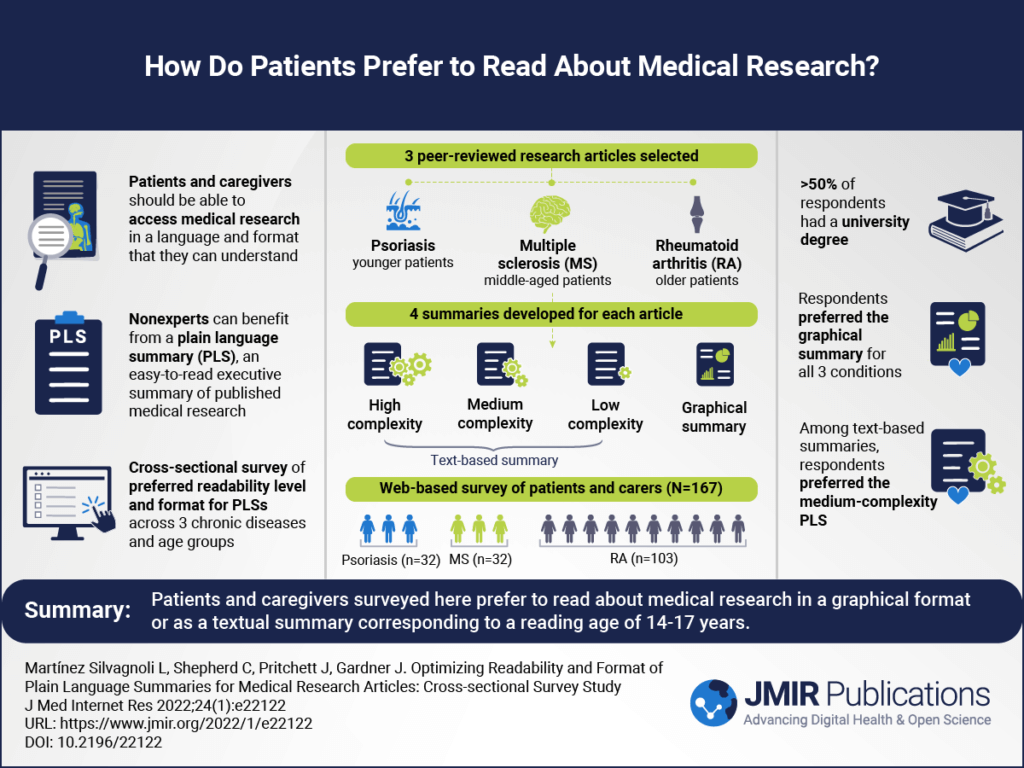
An adapted version of the visual abstract could also become a valuable asset for the creation of the EU CTR required lay summary, which should summarize the study design and endpoints of a study in terms that are easily understood by persons with limited health literacy (Further information: EU CTR: How to write a good Lay Summary of clinical study results). The corresponding guidance documents encourage the use of infographics in lay summaries (1, 2). The use of infographics for patient education is already associated with positive outcomes, such as an improvement of health knowledge (9).
Visual Abstract – Suggested workflow
The principles that apply to the design process of infographics are also applicable during the creation of a visual abstract (9). First, it is important to note the journal’s guidelines or templates before starting the design process to avoid unnecessary work.
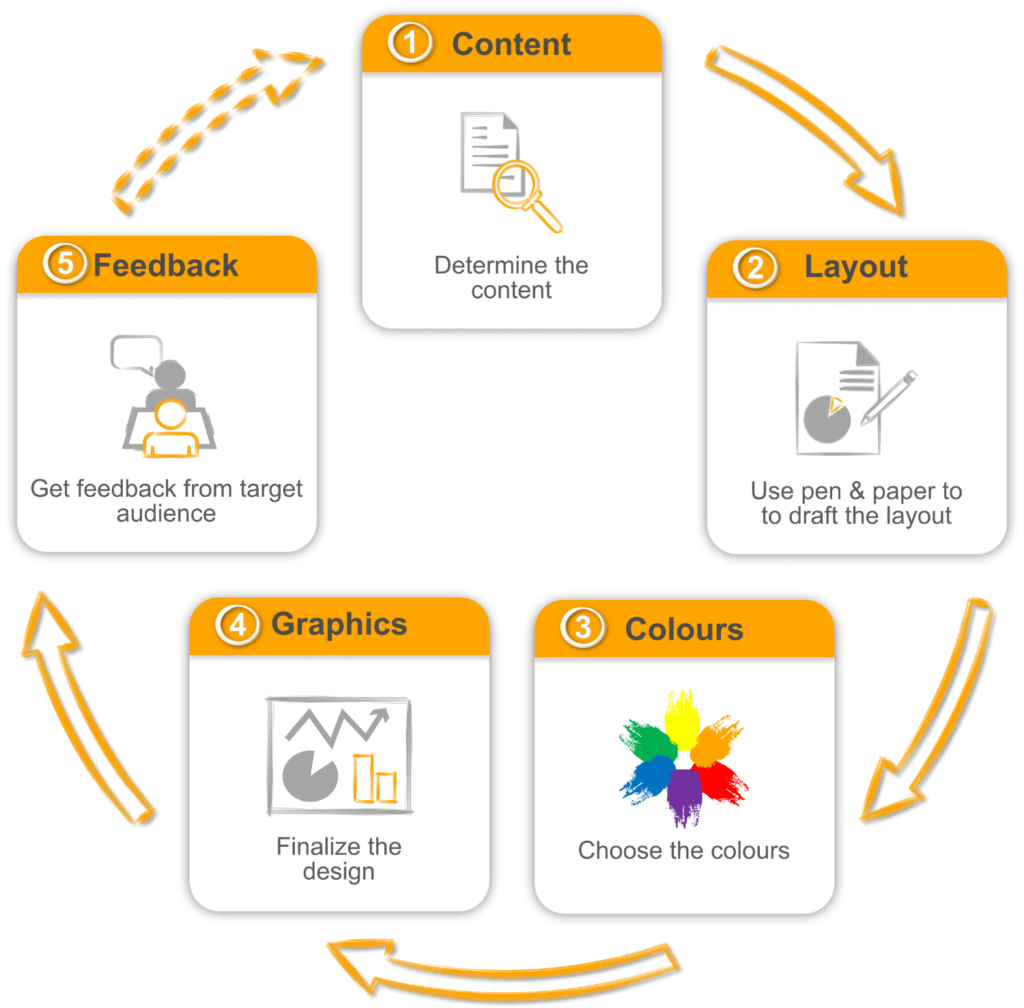
1. Determine the content by considering the planned purpose, the key message and the target audience. The key message should comprise one sentence and the visual abstract should focus on transporting this main statement. Avoid distracting information or details.
2. Use pen and paper to draft the layout. Creating a layout on paper before engaging with graphic design programs avoids being limited by templates, getting lost in details, and losing focus on presenting the key message. The layout should reflect the purpose of the visual abstract. For example, the comparison of the outcome of two study groups requires a different layout approach than the description of a newly developed diagnostic process.
- Group and/or number content to guide the reader through the visual abstract.
- Work with a “natural flow” (e.g. left to right, top to bottom, or a circle).
- Align the elements and leave enough empty space (“negative space”), so the visual abstract does not appear cluttered and overwhelming.
- Draw inspiration from already published visual abstracts to assist the layout process.
3. Choose the colours. One light (and neutral) colour for about 60% of the space, one dark colour for 30% and finally one colour to highlight the most important content (about 10%) is recommended (60-30-10 rule). There are different approaches to selecting a harmonizing colour palette, such as the selection of monochromatic or complementary colours. Tools such as the Adobe colour-wheel can help identify a suitable colour combination. Beyond predefined colour palettes, the website provides accessibility tools to check the contrast between text and background and the ability to differentiate between colours for colour-blind persons (https://color.adobe.com/).
4. Transfer the layout to your favoured graphic design program and start filling it with the determined content. Graphics should be the preferred mode of presentation; texts should be kept concise. Graphical elements can include tables, flow charts, graphs, icons, illustrations and many more. Choose easy to understand consistent graphical elements and include only those necessary for the presentation of the key message. Keep it simple.
5. Get feedback from the target audience, e.g. fellow scientists or lay persons. Check if the key message and the purpose of the visual abstract are clear and make adjustments if necessary.
The transfer of scientific content into a visual abstract requires not only scientific expertise but also strong graphic design skills. Therefore, it is advisable to obtain input from respective experts throughout the process. For many researchers the design of a good visual abstract is a challenge but it also presents a chance to increase the attention on their research topic that should not be missed.
Visual Abstract – A quick checklist
- Journal’s guidelines are met/ journal’s template was used
- The purpose of the visual abstract is clear
- The key message of the visual abstract is clearly presented
- The visual abstract is not cluttered with distracting information
- The elements are well aligned and arranged with consistent spacing
- There is enough negative space
- There is enough contrast between background and text so it can be easily read
- Important colour differences can be perceived by colour blind persons
- Labels and descriptions are positioned near to the corresponding graphical elements
- All abbreviations are explained
Literature
1 Clinical Trials Expert Group. Good Lay Summary Practice: Version 1; 2021 [cited 2023 Jan 4]. Available from: URL:https://health.ec.europa.eu/system/files/2021-10/glsp_en_0.pdf.
2 European Medicines Agency. Summaries of Clinical Trial Results for Laypersons: Version 2; 2018 [cited 04.01.23]. Available from: URL:https://health.ec.europa.eu/system/files/2020-02/2017_01_26_summaries_of_ct_results_for_laypersons_0.pdf.
3 Griffin C, Aydin A, Dasgupta P. The #VisualAbstract: just a pretty picture? BJU international 2021; 127(1):41–3.
4 Guidolin K, Lin J, Zorigtbaatar A, Nadeem M, Ibrahim T, Neilson Z et al. Evaluating the Accuracy and Design of Visual Abstracts in Academic Surgical Journals. Annals of surgery 2022; 276(5):e275-e283.
5 Ibrahim AM. Use of a VISUAL ABSTRACT to Disseminate Scientific Research: Version 4, 2018 [cited 2023 Jan 4]. Available from: URL:https://static1.squarespace.com/static/5854aaa044024321a353bb0d/t/5a527aa89140b76bbfb2028a/1515354827682/VisualAbstract_Primer_v4_1.pdf.
6 Joshi M, Gupta L. Preparing Infographics for Post-publication Promotion of Research on Social Media. Journal of Korean medical science 2021; 36(5):e41.
7 Ramos E, Concepcion BP. Visual Abstracts: Redesigning the Landscape of Research Dissemination. Seminars in nephrology 2020; 40(3):291–7.
8 Rodríguez Estrada FC, Davis LS. Improving Visual Communication of Science Through the Incorporation of Graphic Design Theories and Practices Into Science Communication. Science Communication 2015; 37(1):140–8.
9 Spicer JO, Coleman CG. Creating Effective Infographics and Visual Abstracts to Disseminate Research and Facilitate Medical Education on Social Media. Clinical infectious diseases : an official publication of the Infectious Diseases Society of America 2022; 74(Suppl_3):e14-e22.

Dragan | Co-Founder & CTO
Climedo
Digital health entrepreneur. Passionate about clean UX and travelling to exotic countries. Creates products with love at Climedo Health.
You may also like these articles