5 Tips to Successfully Use Dashboards in Clinical Trials
DATE
May 17, 2023
AUTHOR
Dragan | Co-Founder & CTO
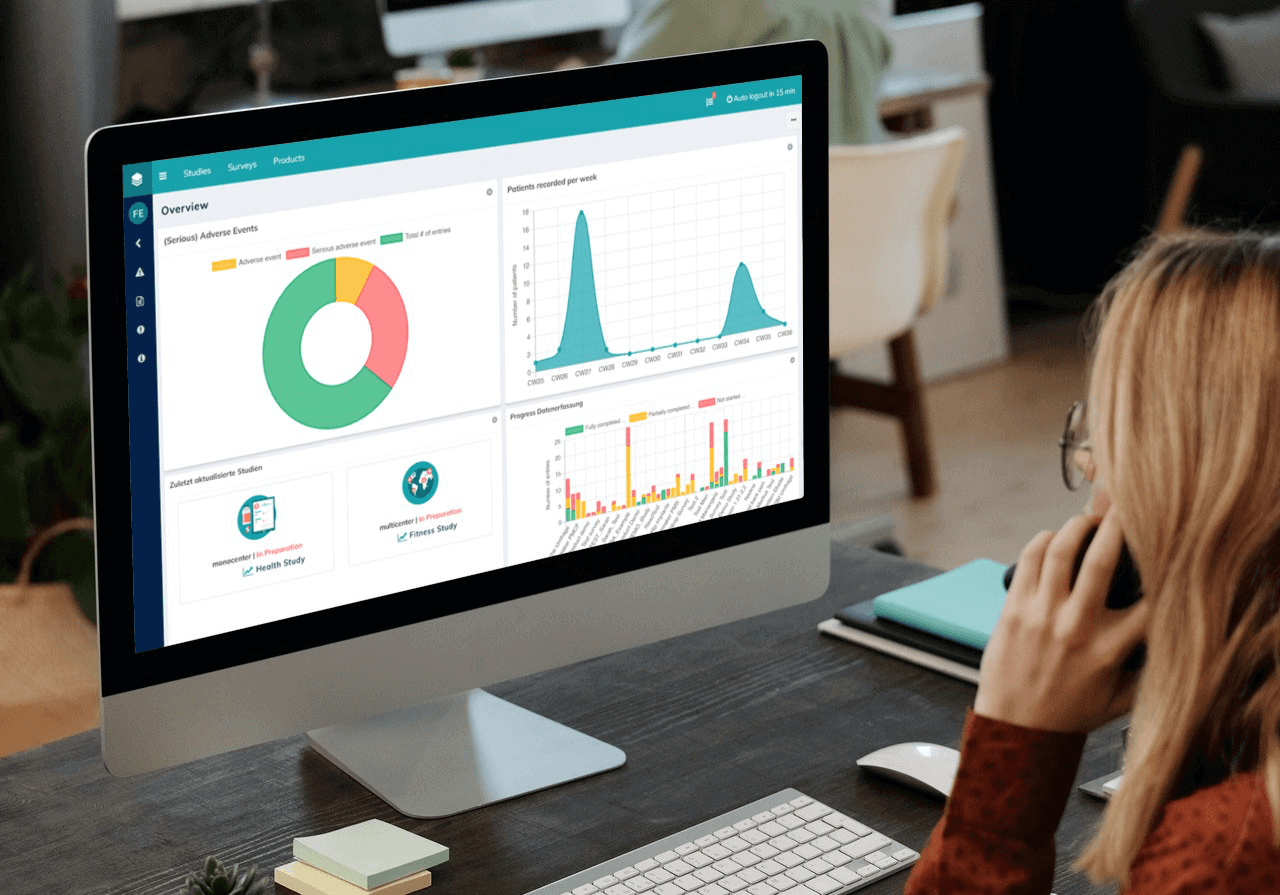
Digitalization in healthcare is moving forward at an unstoppable pace. Since the beginning of the pandemic, even the most conservative healthcare representatives can no longer deny that digital tools such as electronic data capture (EDC) are making clinical data management much easier. However, the easier and faster large amounts of data are collected, the more data researchers must sift through and analyze. This takes up valuable time. Therefore, it is helpful to visualize the data in dashboards. This enables healthcare professionals to maintain an overview at all times, identify irregularities or outliers and make informed decisions.
The use of dashboards doesn’t only benefit researchers. Internal stakeholders, such as sponsors, can also follow the progress of the study in real time, view interim results and easily form their own opinion. In the past, this required a lot of training, as the data was only available in tabular form and had to be evaluated first.
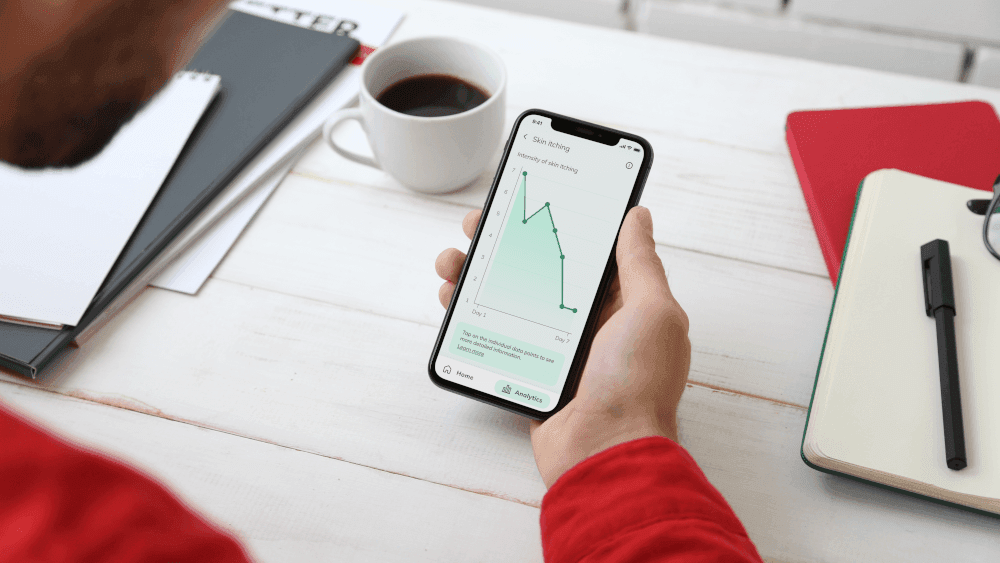
But what are digital dashboards exactly? They’re a tool that automatically tracks, analyzes and visually presents various data points. Users have the opportunity to view all data in real time. The graphical representation makes it easy to understand even for medical laypersons such as study participants or administrative staff.
Whitepaper: From Data to Dialogue | Elevating Science-Based Communication in Post-Approval Studies
Our free Whitepaper explores how to gain an advantage in the post-approval phase, with a focus on non-interventional studies (NIS). It outlines strategies to turn data into dialogue through modern digital tools and touches on challenges in post-approval studies, how interactive digital tools can help address these and showcases a real-world use case with our benchmarking and progression solutions.

Nevertheless, such a dashboard with its many functions can seem intimidating at first. That’s why, in this post, we’ll show you five tips to help you get the most out of your dashboards – so that your clinical trials will benefit in the long term.
How to get the most out of your data visualization dashboards:
1) Using a single login
2) Integrating different data sources in real time
3) Using and customizing dashboard templates
4) Using reporting features
5) Ensuring data privacy with centralized data collection
1) Using a single login
Take advantage of your dashboard’s single login, such as the one offered by Climedo. This feature allows you to have all clinical data of all data points in one central place. The entire study team can easily monitor the data without having to keep track of countless documents, tables and values. This helps to minimize potential risks to patients during the study and to monitor the safety and efficacy of therapies and medical steps. In addition, study sponsors and other stakeholders can access the data they need at any time, e.g. to clarify financing issues and make short-term decisions. For this purpose, different roles and rights can be assigned within the platform.
2) Integrating different data sources in real time
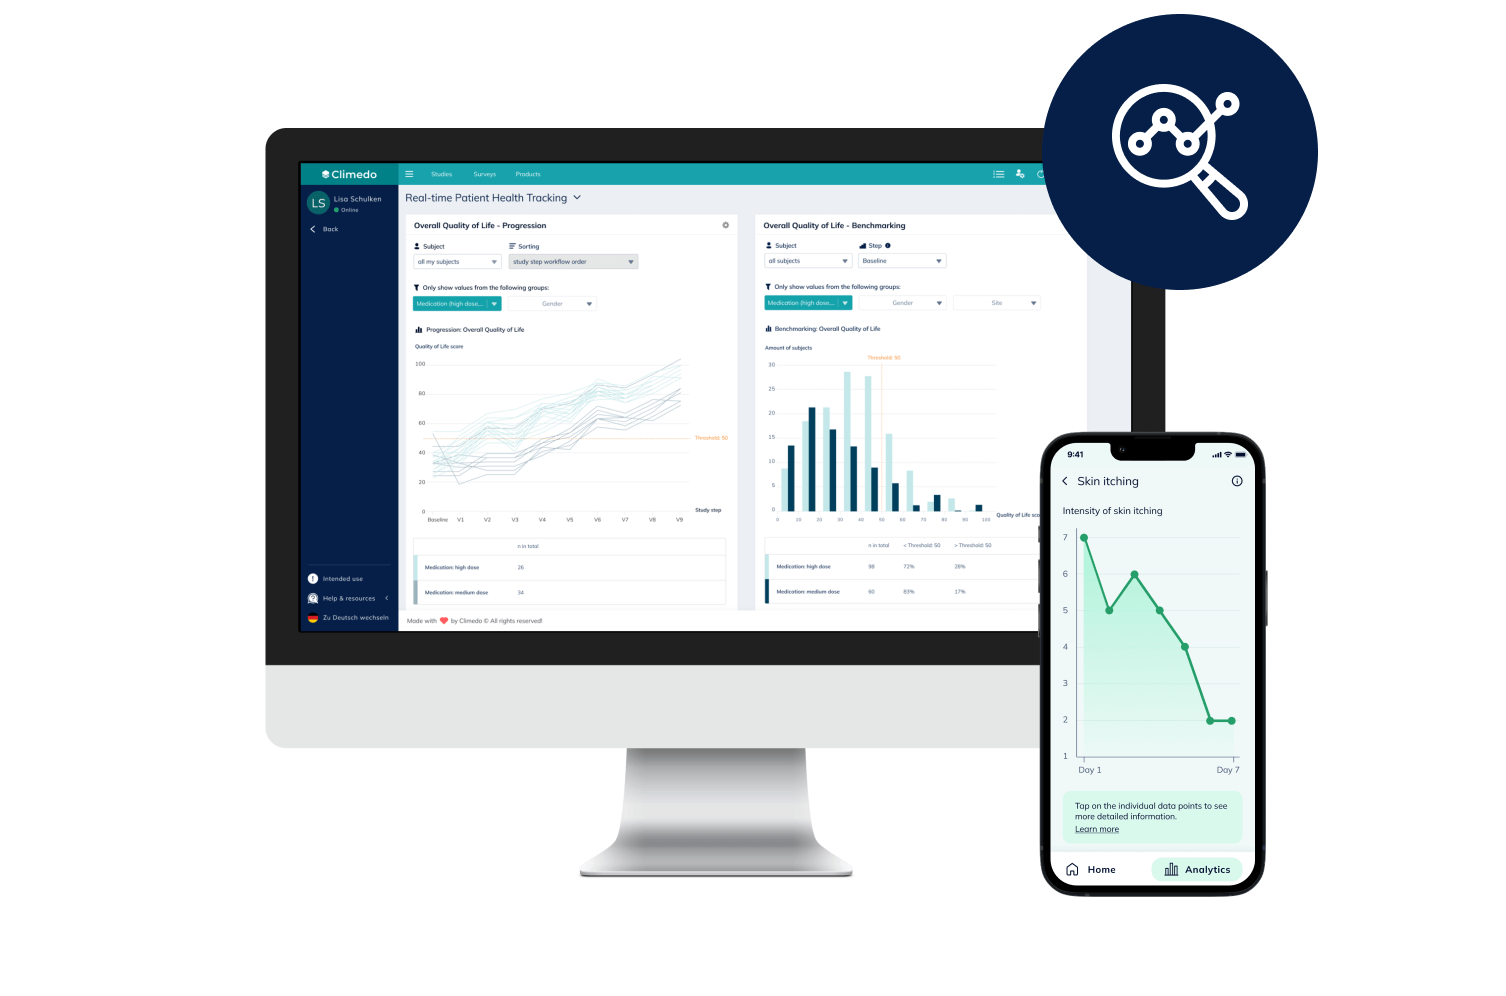
Digital dashboards let you integrate various external data sources. Numerous interfaces are available for this purpose, e.g. to EDC systems, imaging databases, the central laboratory or medical wearables. Since the dashboards are based on a cloud architecture, they connect not only the data points but also all participants in a clinical trial – in real time. This opens up many possibilities, such as the implementation of benchmarking or progression functions. These allow individual data points of participants to be compared anonymously with the comparative value of the entire population or to display its development over a defined period of time. Thus, problems such as SAEs can be identified more quickly.
Our Co-Founder and COO Veronika Schweighart sees great potential for clinical trials: “Let’s assume that a diabetes patient is taking part in a clinical trial for insulin. In the Climedo dashboard, the treating physicians can see the progress based on the blood glucose level or blood pressure value and track how the values behave in comparison to the entire study population and within certain weight or BMI classes. This greatly improves transparency about the study progress.”
3) Using and customize dashboard templates
Digital dashboards usually come with a set of templates. These allow users to easily create analytics for known data sources with just a few clicks. With the help of such templates, data in widgets, for example, updates automatically when new forms are filled out. They can also be created for specific clinical images or therapies and then easily reused. All elements can be customized – from the data displayed, the specific type of visualization for users with different levels of expertise, to aspects of accessibility. In this way, the dashboard always corresponds to the qualification level of the respective user. In addition, individual dashboards can be created for different target groups, such as sponsors, medical staff or CROs.
Product Insight: Turn Data into Dialogue with Real-Time Visualizations and Insights
Climedo’s interactive dashboards allow for real-time visualization of clinical trial data as well as the comparison between patient cohorts across different study sites. This boosts KOL engagement, fosters scientific dialogue and improves patient centricity.
4) Using reporting functions
Customizing dashboards for data visualization simplifies workflows and allows for uncomplicated data management. Althoughit cannot replace traditional reporting for clinical trials, this can easily be resolved with the dashboards’ export functions. This allows the analysis data to be exported in a variety of formats, e.g. as CSV, XLSX or PDF. They are suitable for presentation purposes or can be imported into other programs as needed.
5) Ensuring data privacy with centralized data collection
As with any digital tool in healthcare, privacy concerns can arise quickly – especially when sensitive health data is involved. But dashboards offer many opportunities: They allow you to collect data centrally, as well as to quickly find specific data and access it accordingly. In addition, in many cases it makes sense and is necessary to set up pseudonymization. Thanks to automated digital administration, test forms that have been collected can be assigned to individual test subjects exclusively with the aid of a key that is available to a selected group of people – and the anonymity of the participants is preserved at all times.
In order to guarantee 100% data protection with all these functions, you should take a few aspects into account. For example, data management must comply with HIPAA guidelines. In addition, security requirements in accordance with ISO 27001 must be met and a valid SSL certificate must always be used.
Conclusion: Dashboards enable valuable insights in real time
Hybrid and decentralized models are becoming increasingly popular in clinical trials. This is also shown by our recently published survey results. Asking which decentralized elements they use in their trials so far, 43% of the participants from trial sponsors and CROs said “ePRO“, while 37% use informational videos and 33% have experience with both wearables and telemedicine. In light of this development, it is essential that study teams adapt their working practices and data management accordingly.
Interactive dashboards are a useful tool for integrating, sorting and analyzing clinical data with minimal effort. This saves a lot of time and resources, since fewer working steps need to be done manually and answers to specific KPIs or questions can be displayed or answered in a straightforward manner. Overall, dashboards simplify the preparation, maintenance and monitoring of clinical care, as there is no need for time-consuming back and forth between individual systems or files. Thus, the use of digital dashboards has a noticeable positive impact on in-house efficiency.
Data visualization dashboards allow for tangible insights in real time. Compiling data, writing reports, and analyzing multiple data sets can all be accomplished in a short amount of time. This gives stakeholders insight into study progress at any time and allows for early intervention in case of complications. Ultimately, it increases the quality of care and thus also the compliance of the participants.
We’d be happy to support you in efficiently managing data flows and ensuring consistently high data quality in your next clinical trial. Check out our solutions for real-time dashboards or schedule a software demo! We look forward to hearing from you.

Dragan | Co-Founder & CTO
Climedo
Digital health entrepreneur. Passionate about clean UX and travelling to exotic countries. Creates products with love at Climedo Health.
You may also like these articles